This article will present a deadlock and some tools to examine and identify it.
A deadlock situation happens when two or more threads are waiting to acquire the object monitor of one or more objects that are already locked one of the competing threads. Hence, the threads will wait forever, if there are no detection and prevention strategies.
The following little code snippet simulates the occurrence of a deadlock, between two competing threads.
In the above situation, thread named ‘Left-1’ tries and acquires the monitor of object named ‘left’. Then it sleeps for a couple of seconds and tries to acquire the monitor of object named ‘right’, but ‘Right-1’ thread has already done so. The two threads have no back out logic, hence that program execution will freeze forever.
Detecting a deadlock
Although, in the above example the program is trivial and we can immediately understand where and why the deadlock is happening, in a real-world application that might be a bit tricky. The easiest way is to get a thread dump and analyze it.
- Using an IDE
In case you were running the application locally, from your IDE, most of the chances are that your IDE already have the ability to do so. I am mainly using IntelliJ. You can find that functionality in the ‘Run’ window as shown below.
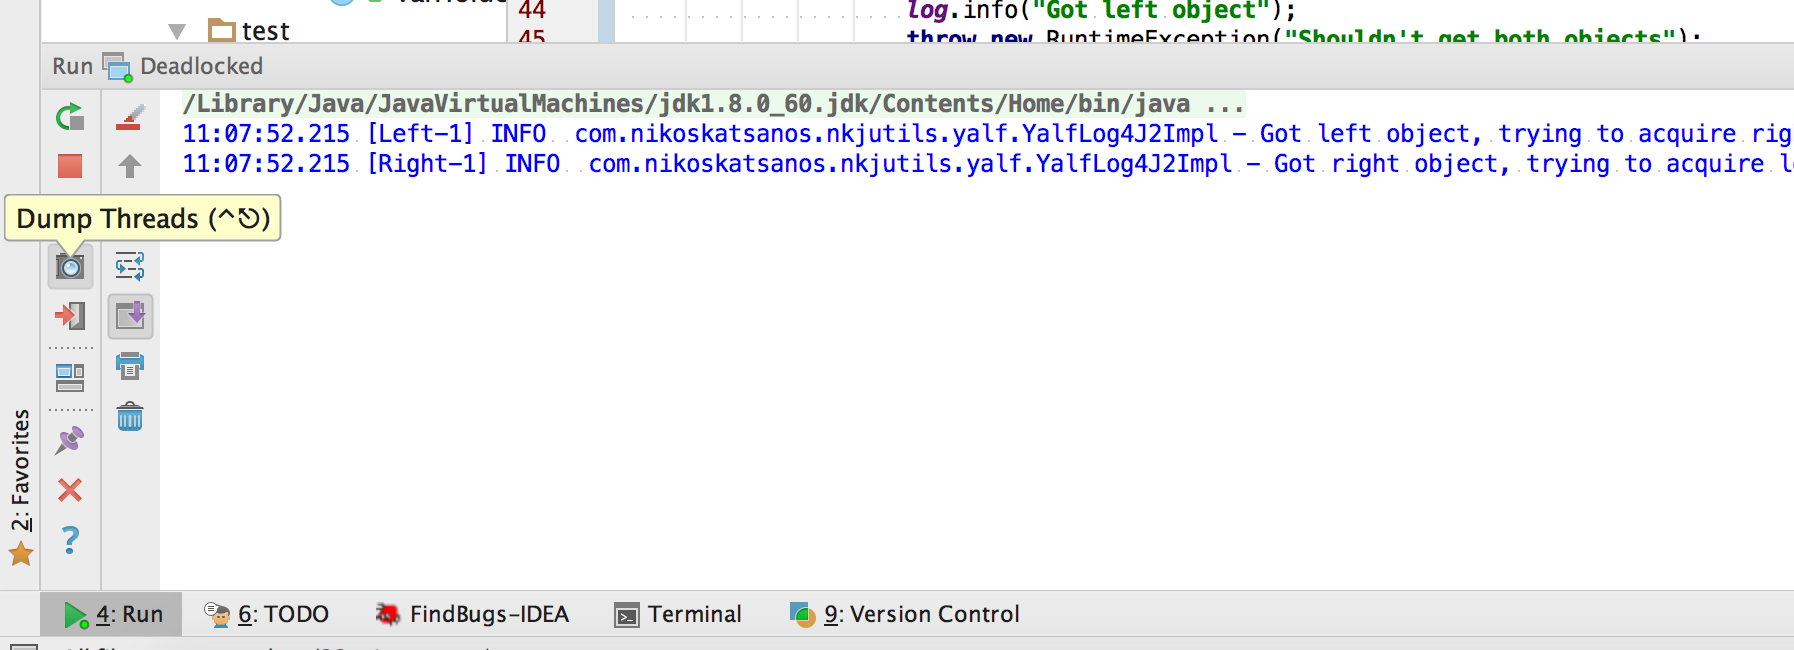
That will dump in your standard output all the threads with their stack and the state they are in.
"Right-1" #13 prio=5 os_prio=31 tid=0x00007f8444219800 nid=0x5503 waiting for monitor entry [0x000070000134f000]
   java.lang.Thread.State: BLOCKED (on object monitor)
	at com.nikoskatsanos.deadlock.Deadlocked.lambda$start$1(Deadlocked.java:44)
	- waiting to lock <0x00000007970c0328> (a java.lang.Object)
	- locked <0x00000007970c05c0> (a java.lang.Object)
	at com.nikoskatsanos.deadlock.Deadlocked$$Lambda$2/1241276575.run(Unknown Source)
	at java.util.concurrent.ThreadPoolExecutor.runWorker(ThreadPoolExecutor.java:1142)
	at java.util.concurrent.ThreadPoolExecutor$Worker.run(ThreadPoolExecutor.java:617)
	at java.lang.Thread.run(Thread.java:745)

"Left-1" #12 daemon prio=5 os_prio=31 tid=0x00007f8443944800 nid=0x530f waiting for monitor entry [0x000070000124c000]
   java.lang.Thread.State: BLOCKED (on object monitor)
	at com.nikoskatsanos.deadlock.Deadlocked.lambda$start$0(Deadlocked.java:33)
	- waiting to lock <0x00000007970c05c0> (a java.lang.Object)
	- locked <0x00000007970c0328> (a java.lang.Object)
	at com.nikoskatsanos.deadlock.Deadlocked$$Lambda$1/1022308509.run(Unknown Source)
	at java.util.concurrent.ThreadPoolExecutor.runWorker(ThreadPoolExecutor.java:1142)
	at java.util.concurrent.ThreadPoolExecutor$Worker.run(ThreadPoolExecutor.java:617)
	at java.lang.Thread.run(Thread.java:745)
The above is part of the thread dump created by IntelliJ, which includes the stack of our two deadlocked threads. By analyzing the above snippet, we can see that both threads are in the ‘BLOCKED’ state and both of them are waiting to lock an object. If we observe closer the objects that each thread is trying to lock, is the one already locked by the other thread. This indication and a look at our source code, which will ensure that those locks will never be released, is enough for us to come to our conclusion.
- Using a tool
Another way to analyze and detect a deadlock, would be to use a more sophisticated tool. There are plenty out there some of them commercial and some of them shipped with your JDK. Three of the most popular are: JConsole, JVisualVM and JavaMissionControl.
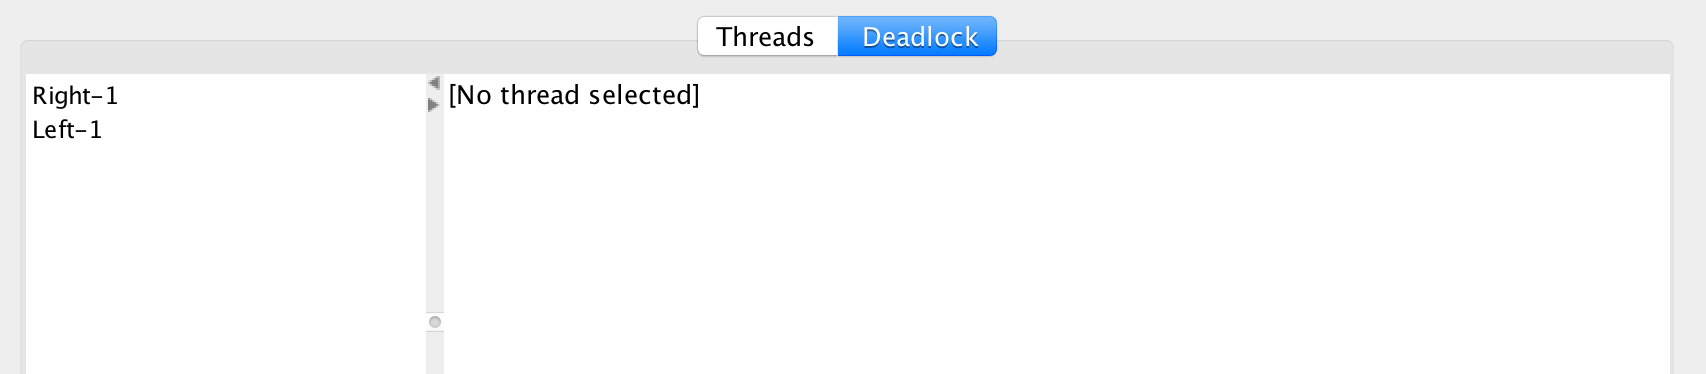
Those tools are very easy in use and all of them are quite similar. JConsole is probably the simplest. Using JConsole requires to launch the application and connect to the process running the application you want to analyze. Once started, the user can find a tab named ‘Threads’. That screen will give the user everything he/she needs. The user can examine the existing threads. The information is actually the same as the one produced by IntelliJ above and we will see the reason further below. But most importantly the user can notice a detect deadlock button on the bottom. By just using that button makes it extremely easy to find if a deadlock is present in the application. It will look like below, which indicates the two threads on the left hand side are in a deadlock.
- Using jstack
Finally, in many cases the application might be running in a server and the only way to interact with it is a shell. In such cases the user needs to use command line utilities provided by the JDK itself. More specifically the jstack. jstack is what is actually used underneath the covers by the above two ways.
In order to do that the user needs to find the process’ PID. That can be done either by using OS level command or by just using the jps command, which also comes with the JDK. Once the user has the pid he/she can invoke jstack command in order to get an output similar to the above tools.
jstack -l ${PID}
The full source code for the example can be found in GitHub.