High CPU utilization Java application
Every now and then we find ourselves in situations when a single Java process is consuming a high percentage of CPU.

After investigating and ruling out high CPU because of continuous GC cycles or other pathogenic reasons, we find ourselves in a situation that we need to identify the business logic that causes those CPU spikes. An easy way of doing so is try to identify the thread(s) that is consuming most of the CPU and try to pinpoint the caveat.
There are a few utilities (i.e. top, htop) that let us see a process as a tree along with the threads that live inside that process’ space. After identifying the thread’s ID, it is pretty easy to translate the ID to its HEX value and identify the actual thread in a Java application (i.e. by taking a thread dump).
Example
As an example the following Java program, uses two application thread’s (main thread and a thread created by the user), one thread is spinning forever generating random values. The main thread occasionally, reads those random values.
It is expected that this would be a high CPU utilization application (see above image).
Find the Rogue Thread
After identifying the Java program’s PID (i.e. with jps or something like ps, top, htop), we can run an application like htop as below
htop -p${PID}
A user can view that isolated process along with its threads. Usually htop would show user space threads by default, but if not is easy to do by going to the setup page and selecting the appropriate option on Setup -> Display Options.
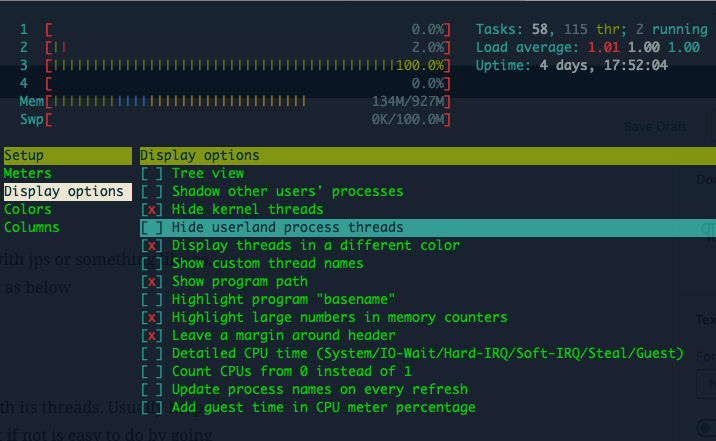
Then a user should see an image like the below.
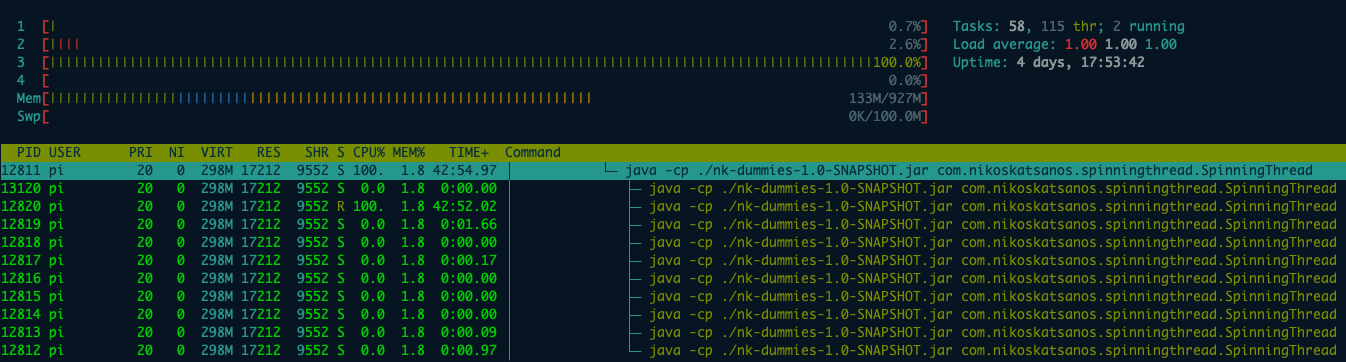
That shows the application’s PID along with its threads, reporting the metrics (CPU, Memory etc) for each thread. From there someone can easily identify that thread 12820 is consuming a great percentage of CPU, hence it should be our caveat.
Translating Thread’s ID to HEX
The next step would be to translate that thread’s decimal ID to its HEX value, which is: 0x3214
Getting a thread dump
Knowing the thread’s HEX value, the user can take a thread dump and easily locate the thread and its stack trace.
Full thread dump Java HotSpot(TM) Client VM (25.65-b01 mixed mode):

"Attach Listener" #8 daemon prio=9 os_prio=0 tid=0x64900800 nid=0x3340 waiting on condition [0x00000000]
   java.lang.Thread.State: RUNNABLE

   Locked ownable synchronizers:
        - None

"Spinner" #7 daemon prio=5 os_prio=0 tid=0x6442a800 nid=0x3214 runnable [0x6467d000]
   java.lang.Thread.State: RUNNABLE
        at java.util.concurrent.ThreadLocalRandom.nextDouble(ThreadLocalRandom.java:442)
        at com.nikoskatsanos.spinningthread.SpinningThread.spin(SpinningThread.java:16)
        at com.nikoskatsanos.spinningthread.SpinningThread$$Lambda$1/28014437.run(Unknown Source)
        at java.util.concurrent.ThreadPoolExecutor.runWorker(ThreadPoolExecutor.java:1142)
        at java.util.concurrent.ThreadPoolExecutor$Worker.run(ThreadPoolExecutor.java:617)
        at java.lang.Thread.run(Thread.java:745)

   Locked ownable synchronizers:
        - <0x659c2198> (a java.util.concurrent.ThreadPoolExecutor$Worker)

"Service Thread" #6 daemon prio=9 os_prio=0 tid=0x76183c00 nid=0x3212 runnable [0x00000000]
   java.lang.Thread.State: RUNNABLE

   Locked ownable synchronizers:
        - None

"C1 CompilerThread0" #5 daemon prio=9 os_prio=0 tid=0x76180c00 nid=0x3211 waiting on condition [0x00000000]
   java.lang.Thread.State: RUNNABLE

   Locked ownable synchronizers:
        - None

"Signal Dispatcher" #4 daemon prio=9 os_prio=0 tid=0x7617f000 nid=0x3210 runnable [0x00000000]
   java.lang.Thread.State: RUNNABLE

   Locked ownable synchronizers:
        - None

"Finalizer" #3 daemon prio=8 os_prio=0 tid=0x76162000 nid=0x320f in Object.wait() [0x64f9c000]
   java.lang.Thread.State: WAITING (on object monitor)
        at java.lang.Object.wait(Native Method)
        - waiting on <0x65806400> (a java.lang.ref.ReferenceQueue$Lock)
        at java.lang.ref.ReferenceQueue.remove(ReferenceQueue.java:143)
        - locked <0x65806400> (a java.lang.ref.ReferenceQueue$Lock)
        at java.lang.ref.ReferenceQueue.remove(ReferenceQueue.java:164)
        at java.lang.ref.Finalizer$FinalizerThread.run(Finalizer.java:209)

   Locked ownable synchronizers:
        - None

"Reference Handler" #2 daemon prio=10 os_prio=0 tid=0x76160800 nid=0x320e in Object.wait() [0x64fec000]
   java.lang.Thread.State: WAITING (on object monitor)
        at java.lang.Object.wait(Native Method)
        - waiting on <0x65805ef8> (a java.lang.ref.Reference$Lock)
        at java.lang.Object.wait(Object.java:502)
        at java.lang.ref.Reference$ReferenceHandler.run(Reference.java:157)
        - locked <0x65805ef8> (a java.lang.ref.Reference$Lock)

   Locked ownable synchronizers:
        - None

"main" #1 prio=5 os_prio=0 tid=0x76107400 nid=0x320c waiting on condition [0x762b1000]
   java.lang.Thread.State: TIMED_WAITING (sleeping)
        at java.lang.Thread.sleep(Native Method)
        at java.lang.Thread.sleep(Thread.java:340)
        at java.util.concurrent.TimeUnit.sleep(TimeUnit.java:386)
        at com.nikoskatsanos.spinningthread.SpinningThread.main(SpinningThread.java:40)

   Locked ownable synchronizers:
        - None

"VM Thread" os_prio=0 tid=0x7615d400 nid=0x320d runnable

"VM Periodic Task Thread" os_prio=0 tid=0x76185c00 nid=0x3213 waiting on condition

JNI global references: 310
The nid value (nid=0x3214) should match the HEX value of the thread’s decimal ID
As seen, in the above case is obvious that thread with name ‘Spinner’ is the high CPU utilization thread we are looking for. After this point the user can investigate the application’s logic and determine the root cause.